
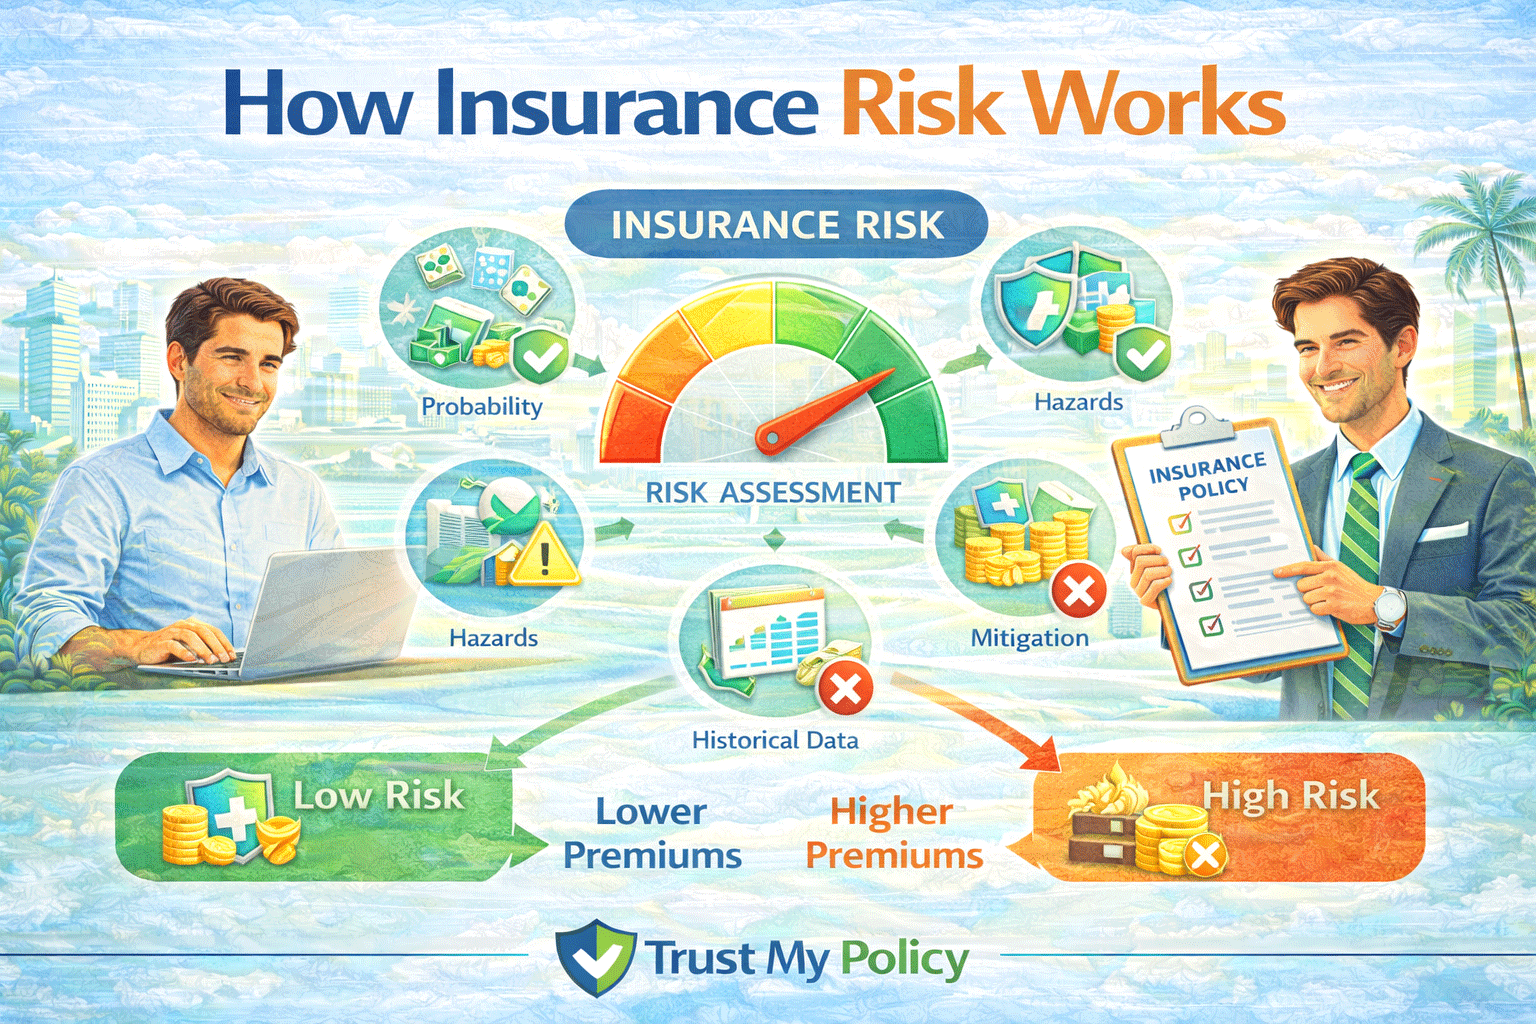
Insurance risk works through risk pooling: insurers group policyholders with similar risk levels, collect premiums from the whole pool, and pay claims for the few who experience a loss. Actuaries use historical data to estimate the probability and cost of future claims, which is why a 19-year-old driver can pay 2–3 times more than a 45-year-old for identical coverage.
Daniel Reyes, 26, couldn’t understand why his car insurance quote in Phoenix was nearly double his older coworker’s quote for the same car. Both drove similar mileage and had clean records. His broker explained it in one sentence: insurers don’t price you as an individual, they price you as a member of a group with a shared statistical risk — and Daniel’s age group simply files more claims.
How Insurance Risk Works in 2026 starts with risk pooling: insurers group people with similar risk profiles, collect premiums from everyone in that pool, and use the money to pay the claims of the few who actually have a loss. Actuaries calculate the odds of a claim using historical data, then price premiums so the pool covers expected payouts plus a margin. This guide explains exactly how that pricing works and why two similar people can pay very different premiums.
This article covers risk pooling, how actuaries price risk, the difference between insurable and uninsurable risk, real pricing scenarios, and what this means for your own premium. By the end, you’ll understand exactly why your quote looks the way it does.
| Feature | Details |
| What it is | The statistical system insurers use to price and pool risk across policyholders |
| Who needs to understand it | Anyone comparing insurance quotes or wondering why premiums differ |
| Typical premium driver | Age, location, claims history, credit-based insurance score, and coverage limits |
| Coverage concept | Risk is spread across a large pool so individual losses don’t bankrupt one person |
| Key benefit | Makes large, unpredictable losses affordable through shared, predictable premiums |
| Key limitation | High-risk individuals can face premiums that feel disproportionately expensive |
| Regulator | State insurance departments (US); Financial Conduct Authority and PRA (UK) |
Most people assume their premium is calculated like a parking fine — a flat number based on a simple rule. It’s closer to a weather forecast. Forecasters don’t know exactly what tomorrow holds, but they can predict probabilities accurately across millions of data points. Insurers do the same thing with your risk of filing a claim.
Insurance risk is the statistical likelihood and potential financial cost of a future loss, which insurers estimate using historical data on similar policyholders. You need to understand this if you’ve ever wondered why your quote differs from a friend’s, or if you’re trying to lower your own premium by changing a specific risk factor.
| Criteria | Insurable Risk | Uninsurable Risk |
| Examples | Car accidents, house fires, death, illness | Reputational damage, normal market investment losses, intentional acts |
| Predictability | Large-pool statistical patterns exist | Often unpredictable or deliberately caused |
| Pros (for insurer) | Can be priced using actuarial data | N/A — insurers generally won’t underwrite it |
| Cons | Premiums rise as risk pools shrink or worsen | No insurance product typically exists for this risk |
| Best for | Standard home, auto, health, and life policies | Risk management strategies outside insurance, like diversification |
We recommend understanding this distinction for most readers because it explains why certain losses — like normal wear and tear or intentional damage — are never covered, no matter the policy.
Scenario 1: Daniel, 26, driver in Phoenix. Daniel pays $2,400 a year for auto insurance, nearly double his 52-year-old coworker’s $1,300 premium for similar coverage. Verdict: this reflects his age group’s statistically higher accident rate, not anything personal. Action: Daniel enrolled in a usage-based telematics program to prove his individual driving is safer than his age group’s average.
Scenario 2: Maria, 34, homeowner in a Florida flood zone. Maria’s home insurance premium is 40% higher than a similar home 20 miles inland. Verdict: her risk pool reflects genuine flood and hurricane exposure data for her zone. Action: Maria added a separate flood policy and raised her deductible to lower her base premium.
Scenario 3: James, 58, applying for life insurance after quitting smoking two years ago. James was quoted a “Standard” rate instead of “Preferred Best” despite quitting smoking. Verdict: most insurers require a multi-year smoke-free period before treating an applicant as a permanent non-smoker. Action: James plans to reapply for a better rate class once he passes the insurer’s required smoke-free threshold.
Scenario 4: A UK driver with five years of named-driver experience before passing their own test. The driver received a lower premium than a same-age peer with zero driving history. Verdict: insurers treat documented driving exposure as a real risk-reducing factor. Action: the driver kept proof of named-driver history to negotiate further discounts at renewal.
| Pros | Cons |
| Spreads catastrophic individual losses across a large, manageable pool. | High-risk individuals can face premiums that feel unaffordable. |
| Rewards genuinely lower-risk behavior with lower premiums. | Some pricing factors, like credit-based scores, feel unrelated to actual risk. |
| Makes large, rare losses financially survivable for everyone in the pool. | Risk pools can shift quickly after a regional disaster, raising premiums fast. |
| Encourages risk-reducing behavior like safe driving or home safety upgrades. | New entrants to a risk category (new drivers, new homeowners) pay the most upfront. |
| Allows insurers to remain solvent enough to pay large claims reliably. | Pricing models can feel opaque to the average policyholder. |
⚠️ WARNING: Never lie about a risk factor — like garaging location or primary use of a vehicle — to lower your premium. Misrepresentation discovered at claim time can void your entire payout.
| Your Situation | Our Recommendation |
| You’re a new driver shocked by a high quote | Yes — ask about telematics or usage-based programs to prove individual risk |
| You live in a high-risk flood or wildfire zone | Yes — get specialized coverage rather than relying on a standard policy alone |
| You recently improved a risk factor (quit smoking, improved credit) | Yes — reapply or request a re-rate after the required waiting period |
| You’re comparing your quote to a dissimilar friend’s quote | No — compare only against people genuinely similar in risk profile |
| You want to lower your premium without changing coverage | Yes — raise your deductible if you can afford the higher out-of-pocket risk |
| You suspect a pricing factor is being misapplied | Yes — request a detailed breakdown of your premium calculation |
| You’re shopping for a first policy as a young adult | Yes — compare at least three insurers, since risk pool definitions vary by company |
💡 TIP: The single golden rule for understanding insurance risk: your premium reflects your risk pool’s statistics, not a personal judgment — focus on the few factors you can actually control.
| Scenario | Typical Premium Impact | Notes |
| Teen driver vs. driver over 40 (US auto) | 2–3x higher premium for the teen | Reflects age-related accident statistics |
| Home in a flood zone vs. inland home (US property) | 20%–50% higher premium | Reflects regional disaster claims data |
| Smoker vs. non-smoker (life insurance) | Often 2x or more higher premium | Reflects mortality risk data |
| Raising auto deductible from $250 to $1,000 | 10%–25% lower premium | Shifts more of the small-claim risk to you |
| Adding telematics/usage-based driving data | Up to 10%–30% lower premium for safe drivers | Replaces group averages with individual data |
| Credit-based insurance score improvement (where used) | Can lower premium meaningfully | Permitted in most but not all US states |
| Bundling home and auto with one insurer | Often 5%–15% combined discount | Reflects lower acquisition cost for the insurer |
Insurance Information Institute (US) — A nonprofit research organization publishing consumer-facing data on how US insurers price and manage risk. Cost range: free resource. Best for: US consumers wanting independent, non-sales-driven explanations. Rating: nonprofit research body, not a carrier.
Association of British Insurers (UK) — The UK industry body publishing data and guidance on how insurers assess and price risk. Cost range: free resource. Best for: UK consumers researching pricing factors. Rating: industry trade association, not a carrier.
NerdWallet — A US comparison and education site that breaks down real premium differences by risk factor across major insurers. Cost range: free to use. Best for: US shoppers wanting side-by-side pricing breakdowns. Rating: independent comparison service.
Compare the Market (UK) — A UK comparison platform showing how risk factors like postcode and driving history change real quotes. Cost range: free to use. Best for: UK shoppers wanting fast multi-carrier comparisons. Rating: FCA-regulated comparison service.
State insurance department consumer guides (US) — Most US states publish free consumer guides explaining permitted rating factors in that specific state. Cost range: free. Best for: anyone wanting to know exactly which factors are legal in their state. Rating: government regulatory resource.
We recommend the Insurance Information Institute as best overall starting point because it’s a neutral, well-sourced resource specifically focused on explaining risk and pricing to everyday consumers.
Insurers group policyholders with similar risk characteristics into pools, then price premiums using actuarial data on how often that pool’s members file claims and how much those claims typically cost.
Even small differences in age, location, claims history, or credit-based insurance score can shift you into a different risk pool with a different expected claims cost.
Yes. Actions like raising your deductible, improving your driving record, or enrolling in a telematics program can move you into a lower-risk pricing tier.
Risk pooling is the practice of grouping many policyholders together so that premiums collected from the whole group can cover the losses of the few who actually claim.
Yes. Many insurers will explain which specific factors most influenced your quote, which helps you identify what you can realistically change.
Even neighboring homes can sit in different flood or wildfire risk zones, have different rebuild costs, or have different claims histories, all of which affect pricing.
No. Each insurer uses its own underwriting model, which is why comparing quotes from multiple companies often reveals meaningful price differences for identical coverage.
Yes. Aging out of a high-risk age bracket, improving your credit, or moving to a lower-risk area can shift you into a more favorably priced pool at renewal.
Risks like intentional acts or normal market investment losses don’t fit the actuarial, large-pool model insurers rely on, so standard insurance products don’t cover them.
It depends on the claim type, your insurer’s policies, and your state or country’s regulations, but a single claim doesn’t always cause a large or permanent increase.
This guide reflects the latest 2026 insurance data.
This article is for informational purposes only. Always consult a licensed insurance professional before making coverage decisions. Trust My Policy does not sell insurance products or represent any insurer.

Jagadeesh Gutha is the founder of TrustMyPolicy.com, an independent insurance information platform covering life, health, car, home, and business insurance for US and UK readers. He researches insurance products, policy structures, and consumer rights to help everyday people make informed coverage decisions without the jargon. All content on TrustMyPolicy is independently researched, fact-checked, and written to educate — not to sell.



Insurance Guides for UK, USA & Worldwide We are not an insurer or broker.


Reader Comments (0)